FRIENDLY INTERFACES TO QUERY:
| 1. IT INCLUDES EXTENDED
DATABASE WITH USER
FRIENDLY INTERFACES TO QUERY: |
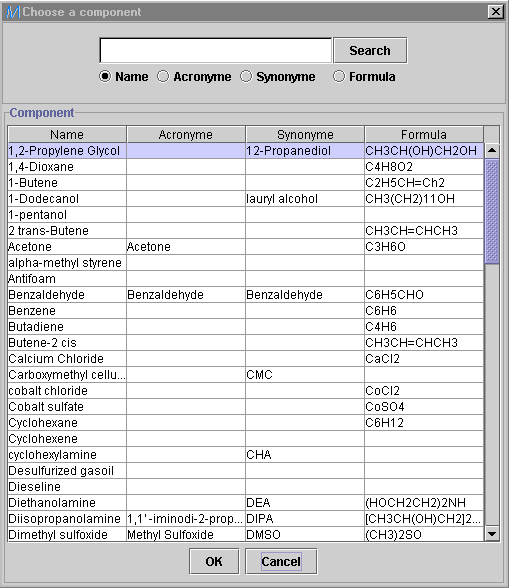
SELECT ONE OR MORE CRITERIA
IN THE FOLLOWING CLASSES:
hydrodynamics,
mass transfer, heat transfer, references,
fluids,
operating conditions, reactor solid, liquid, gas.
| hydrodynamics:
|
mass transfer:
|
heat transfer:
reference:
 |
operating conditions:
reactor:
 |
|
liquid: gas:  |
|
fluids:  |
|
liquid: 
gas:
|
| AS AN EXAMPLE:
- SELECT TOTAL LIQUID HOLDUP AS QUERY CRITERION - EXECUTE SEARCH - AND GET 9076 MEASUREMENTS ! YOU MAY, FIRST, IDENTIFY EACH INVESTIGATION: autor name, date, full reference |
 |

|
| 2. THEN YOU MAY EXPLORE
TRENDS GRAPHICALLY
ON SELECTED MEASUREMENTS |
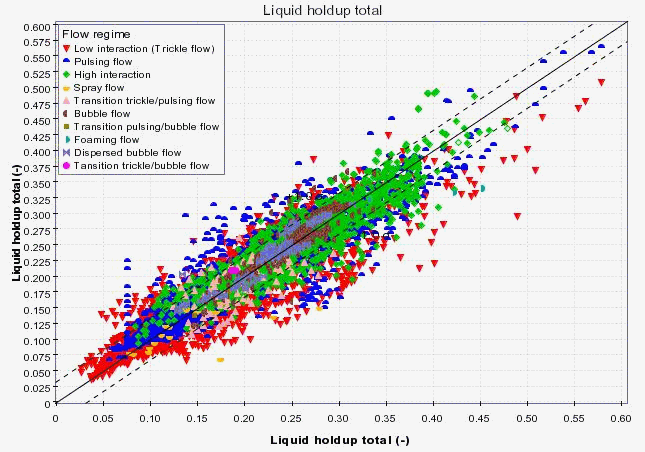
For example, the effect of
liquid superficial velocity on total liquid holdup could be selected and
plotted:

|
| VARIOUS DISCRIMINATION OPTIONS ARE AVAILABLE ON PLOT: |
qualitative discriminations
(as flow regime type illustrated on the previous figure)

or quantitative discriminations
(such as superficial gas velocity range)
|
| 3. YOU MAY EVALUATE ANY MODEL
OR CORRELATION
TO PREDICT A SELECTED PROPERTY OF INTEREST |
 |
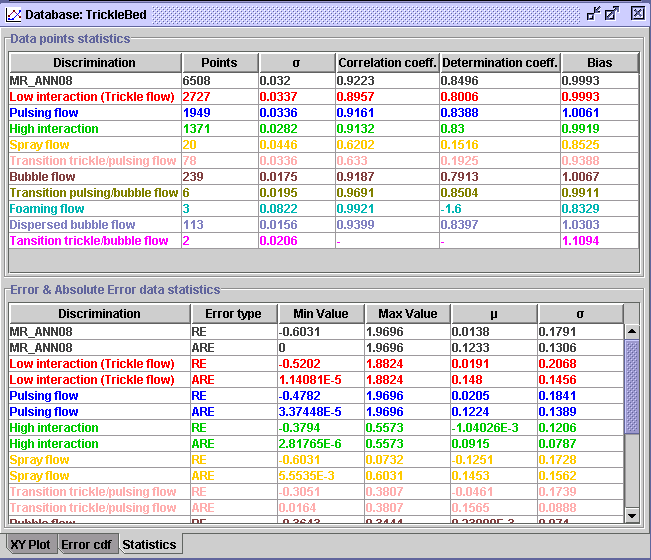
graphical evaluation with
parity plot:
 |
and full statistics reports:

|
on a plot, you may select
a region and get information on seleted points:

|
|
VARIOUS GRAPHICAL OPTIONS ARE AVAILABLE:
|
... as logaritmic scales:

..and more:
|
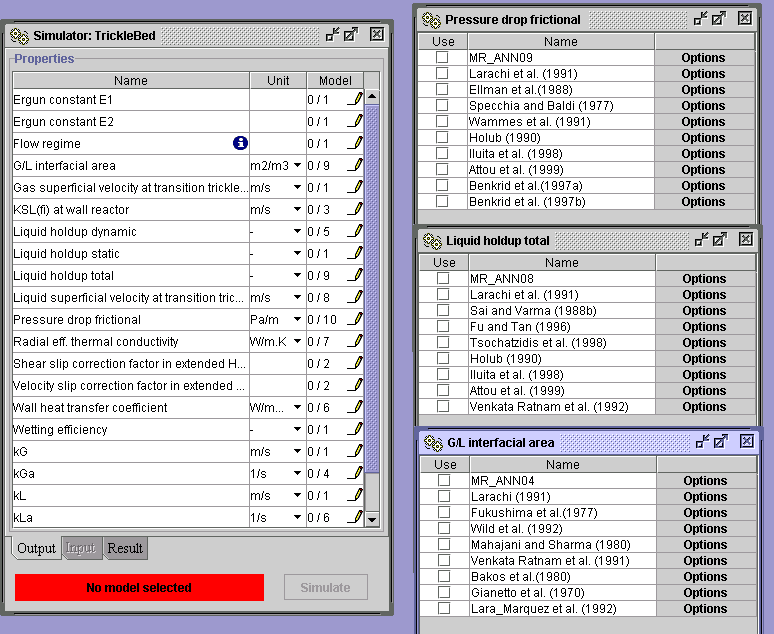
| 4. MULTI_R_DESIGNER INCLUDES
USER FRIENDLY
SIMULATOR: |
SELECT ONE OR MORE AMONG 80
MODELS OR CORRELATIONS,
INCLUDING 20 ARTIFICIAL NEURAL
NETWORK MODELS (ANN):

|
| EACH MODEL IS WELL DOCUMENTED:
required inputs and validity ranges
... and you will be informed if you compute out of that range. |
 |
| One or more models being selected, SELECT YOUR PROPRIETARY DATA FILE TO COMPUTE WITH: |
identify required inputs
to simulate:
 |
simulate and get the results
in a file:
 |
and plot what you want:
as the parity plot with envelopes that could be selected
 |